Hi, I trust that you have enjoyed the read on how to get setup with your ngx-datatables, if not checkout my previous post right here.
You have your ngx-datatable all set and you want to show a cool icon if there is a boolean value. Luckily we have such data in one of our columns.
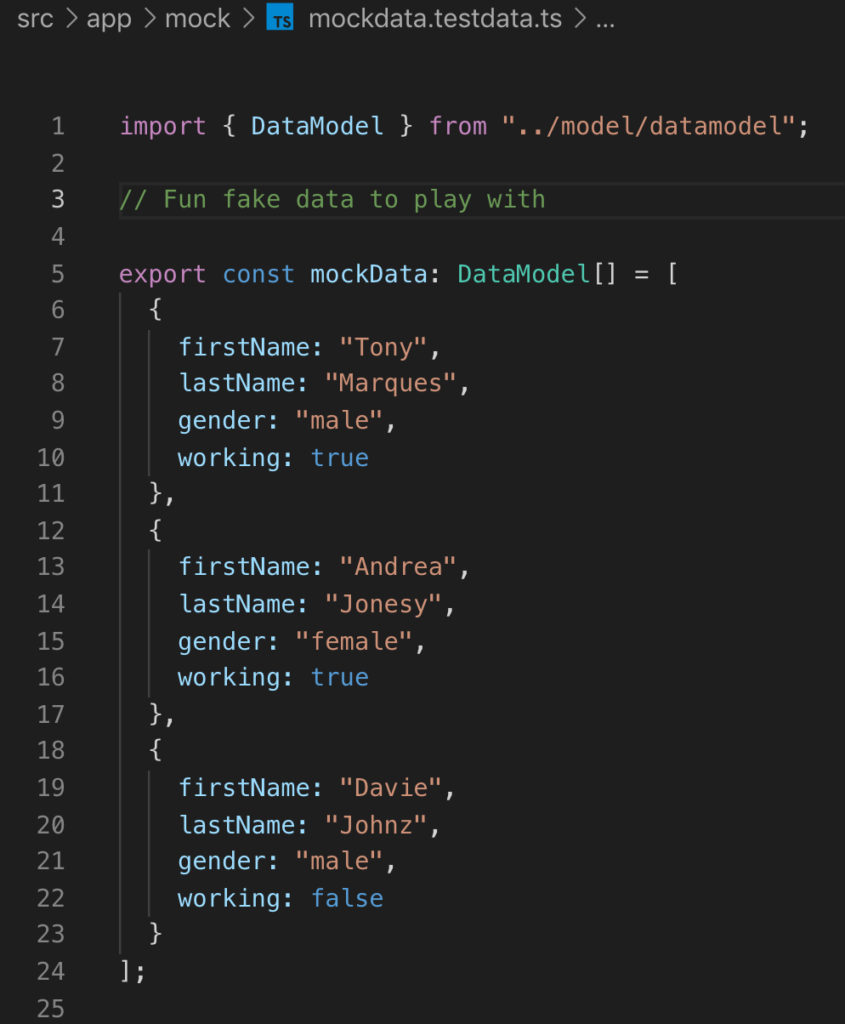
note that the working data is a boolean
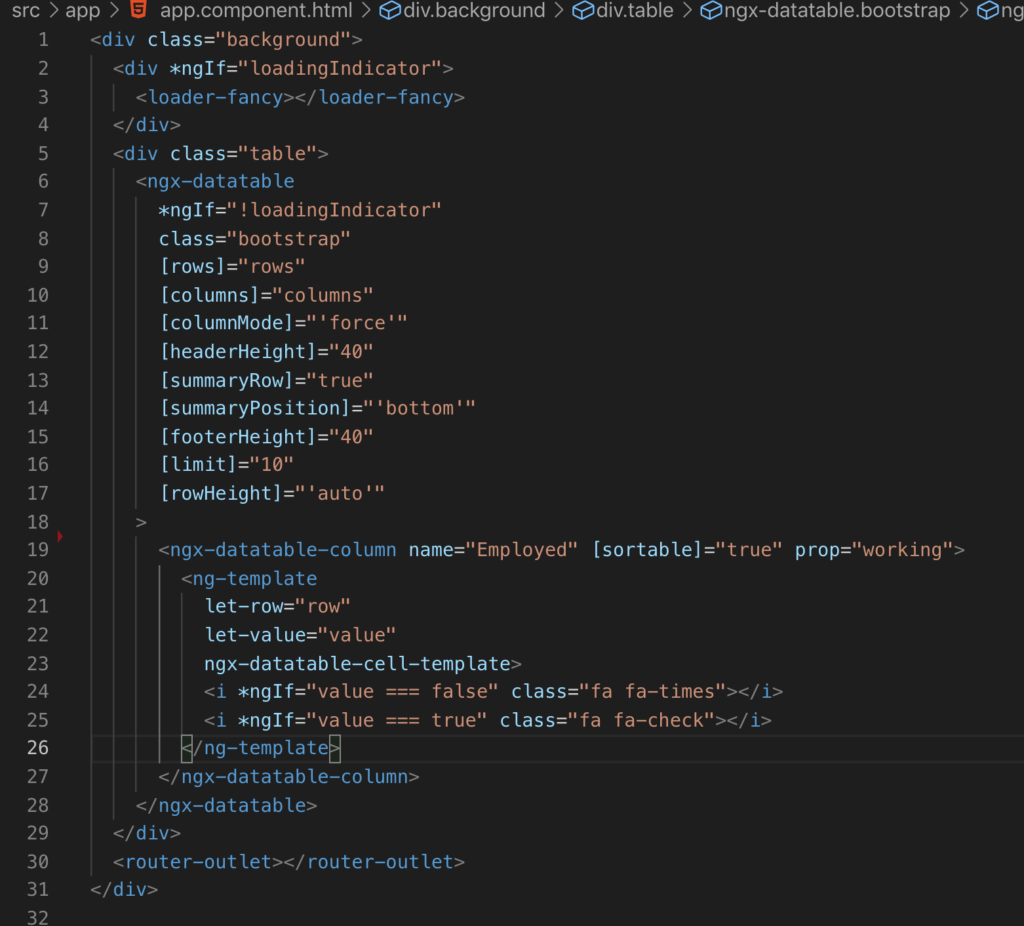
So when looking at the current solution and the HTML (or view as the pros like to call it) you would think that to add conditional rendering logic to a single column, one would need to add the following.
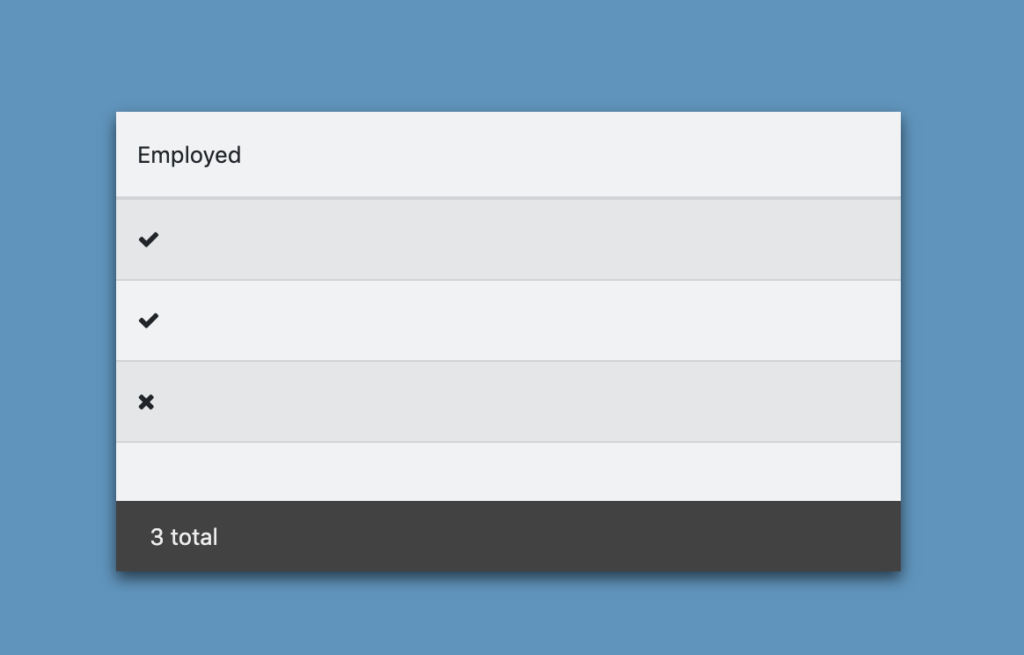
Well I was wrong. The code is correct but, this will not render the entire table as you can see below.
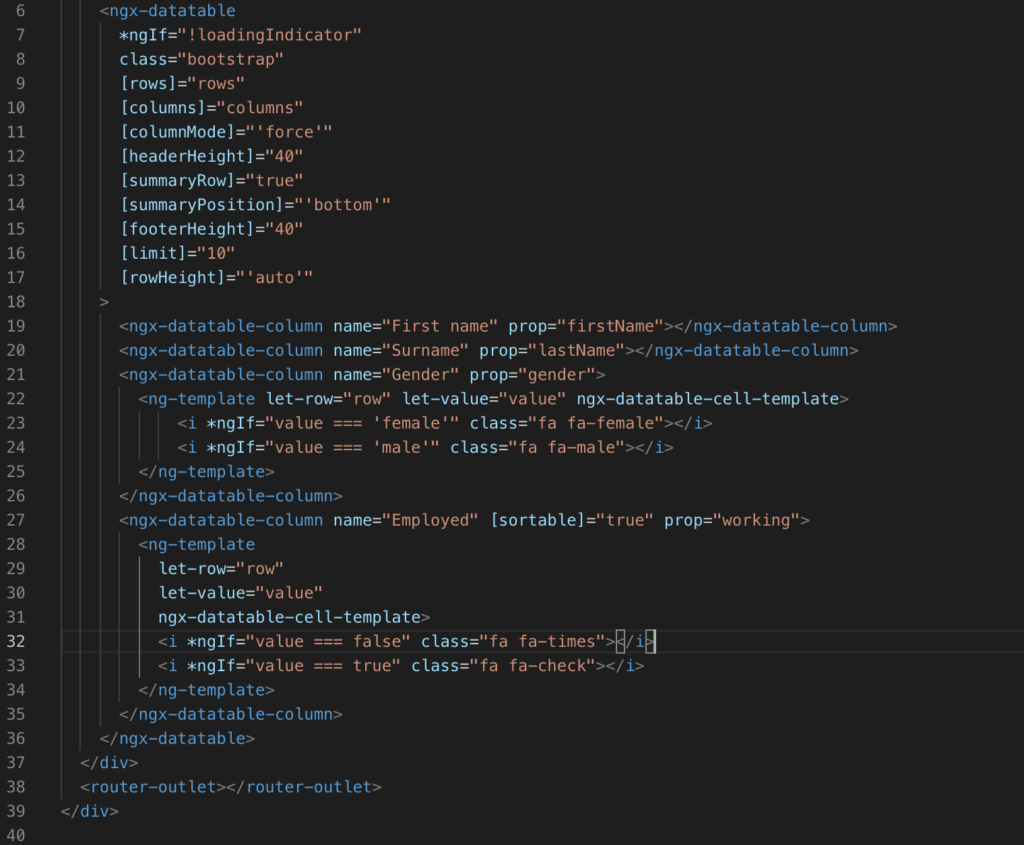
The point that I wanted to make is that you will need to add details now for every column, so if there are a 100 columns you would need to add 100 of them. I also did some conditional rendering with text. HOWEVER, please use boolean values, just wanted to show you that it is possible, but not recommended. Any text change or updates….cases will not make the conditions work.
the final code
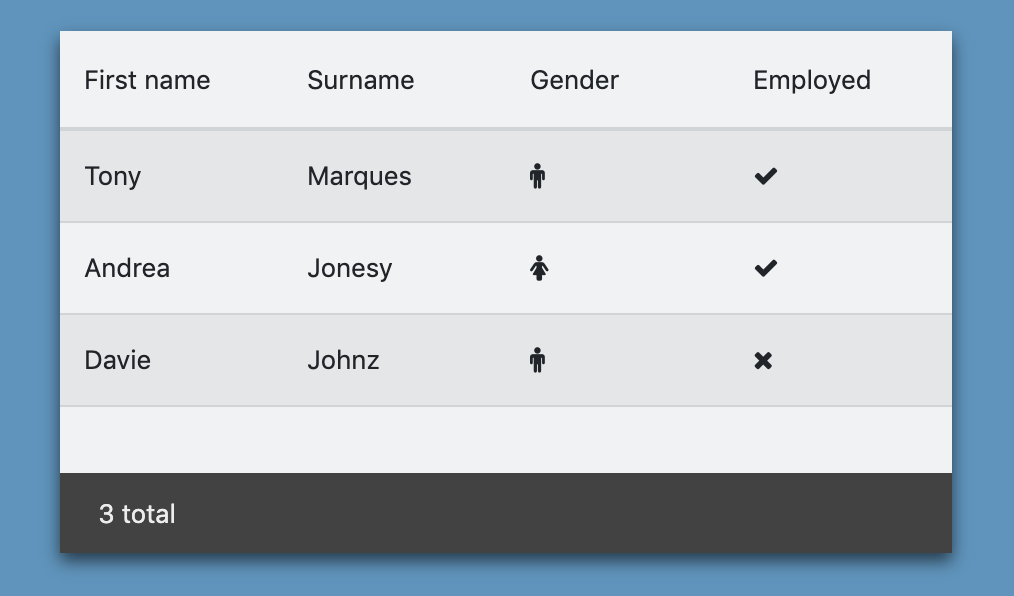
You will need to add column details for every column if you want to use conditional rendering. The end result should look a little something like this.
very sexy I know.
So thats how one would do conditional rendering, using *ngIf logic using the row value boolean variable to dictate what to render.
Before I start, yes the image above has a table in it. I was hoping to fit everything into one blog post, but I think it may be best to breaking down into sections, so if its your first time using ngx tables this will hopefully help me and you on how to set it up more or less.
I was trying to find some sources on ngx-datatables and i only found a video podcast about people talking about how great it is from the creator with no real implementing advice. So I want to try to share my learnings from it
This video didn’t really explain how to use ngx-datatables.
I’ve got a repo on this so you can see how it works with working code, I won’t go through the setup of data (although I have added some comments…fun).
Firstly setup your project and install the ngx-datatable goodies like so.
npm i @swimlane/ngx-datatable --save
One thing I’ve learned is don’t be so afraid of official documentation their docs which can be found here are actually pretty good so don’t be shy to give it a shot and their demos are great.
Side note for the peeps that want to use bootstrap styling on their ngx-dataatable be sure to check my post on adding bootstrapto a project quick and then add this guy to your projects root styles sheet.
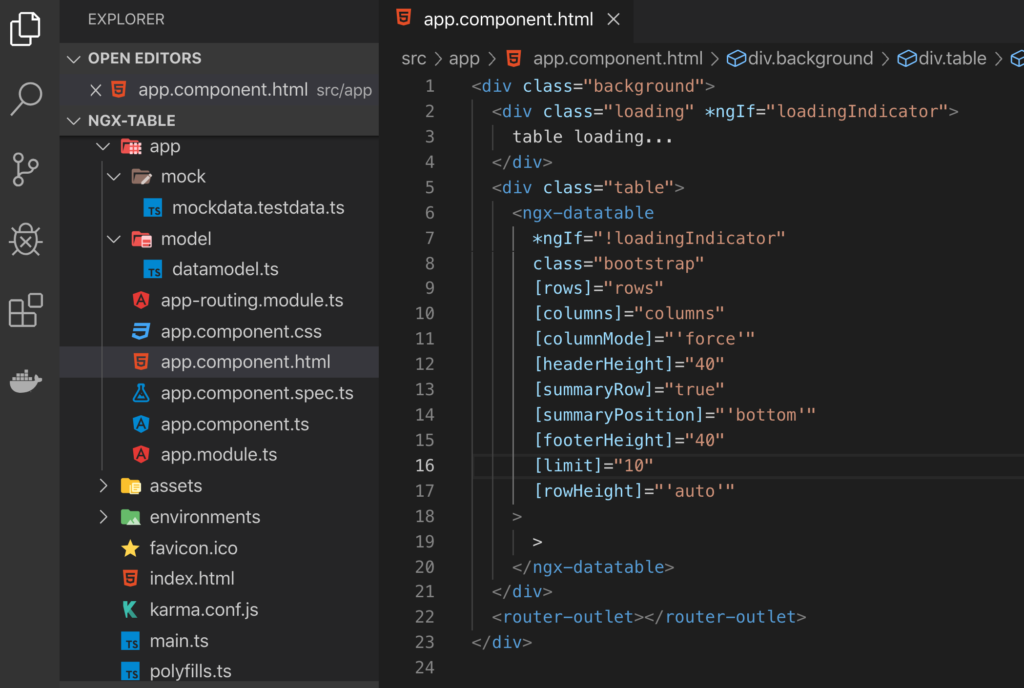
Ok , so your table comes with its basic stuff, a mock services with a data model to utilising the power of intellisense. If you open the master you’ll see in the app.component.html the following structure for the ngx-datatable.
the square bracket stuff.
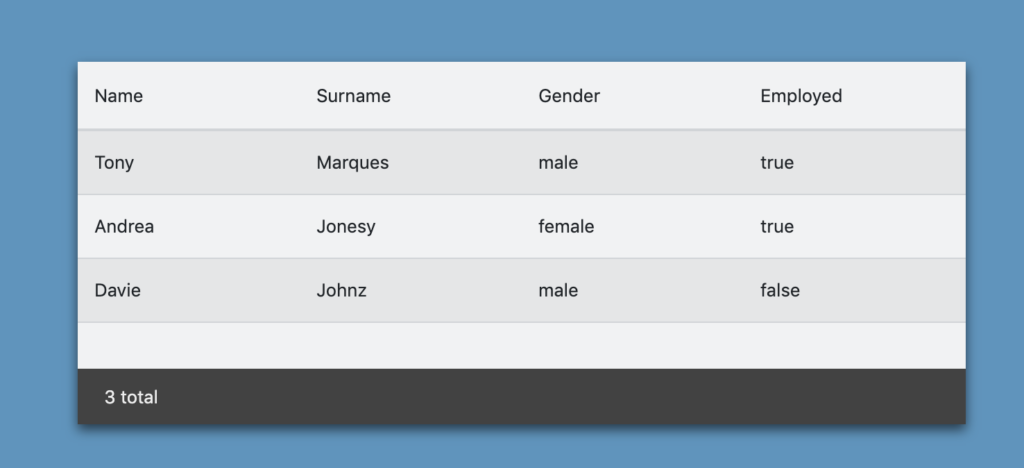
ngx-datatables are pretty fancy and quite easy to custom. from adding a total count to adjusting column length and pagination. Feel free to edit these properties and find out what they are all about. For example the [columnMode]=”‘force'” just tries to let your column stretch across the dimensions so it doesn’t look weird…cause it looks weird without it.
with column force
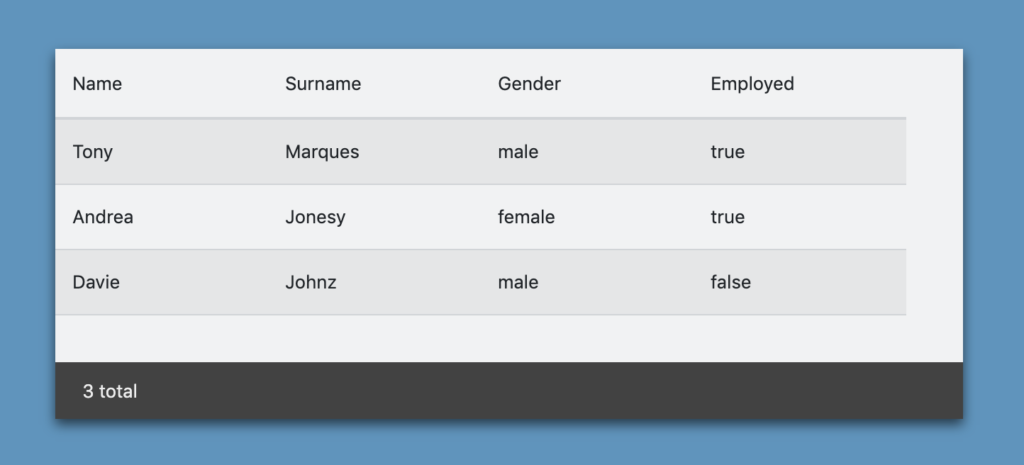
without…gross i know
You will also encounter a columns array with prop and column name objects.
The above code basically states the column names and props. I use the props for mapping the naming convention that i receive from the api (which i have mocked in my sample repo) so when the data comes in it knows where to go and with the name it is just the naming of the columns.
I’ve added an empty array called rows and as you can see in my ngOninIt() function i’m setting the data to the said rows array. then WHAM you have yourself a table showing lovely data. Next up will be conditional rendering… very excited to share it….and you can reduce the load time delay if you like. The loader credit goes to here.